PetSwap
Hemanth Chittanuru (hchittanuru3), Kenny Scharm (kscharm3), Raghav Raj Mittal (rmittal34), Sarah Li (sli469)CS 6476 Computer Vision - Class Project
Georgia Tech, Fall 2019
The code for this project can be found in this repository.
Previous project deliverables: proposal
Abstract
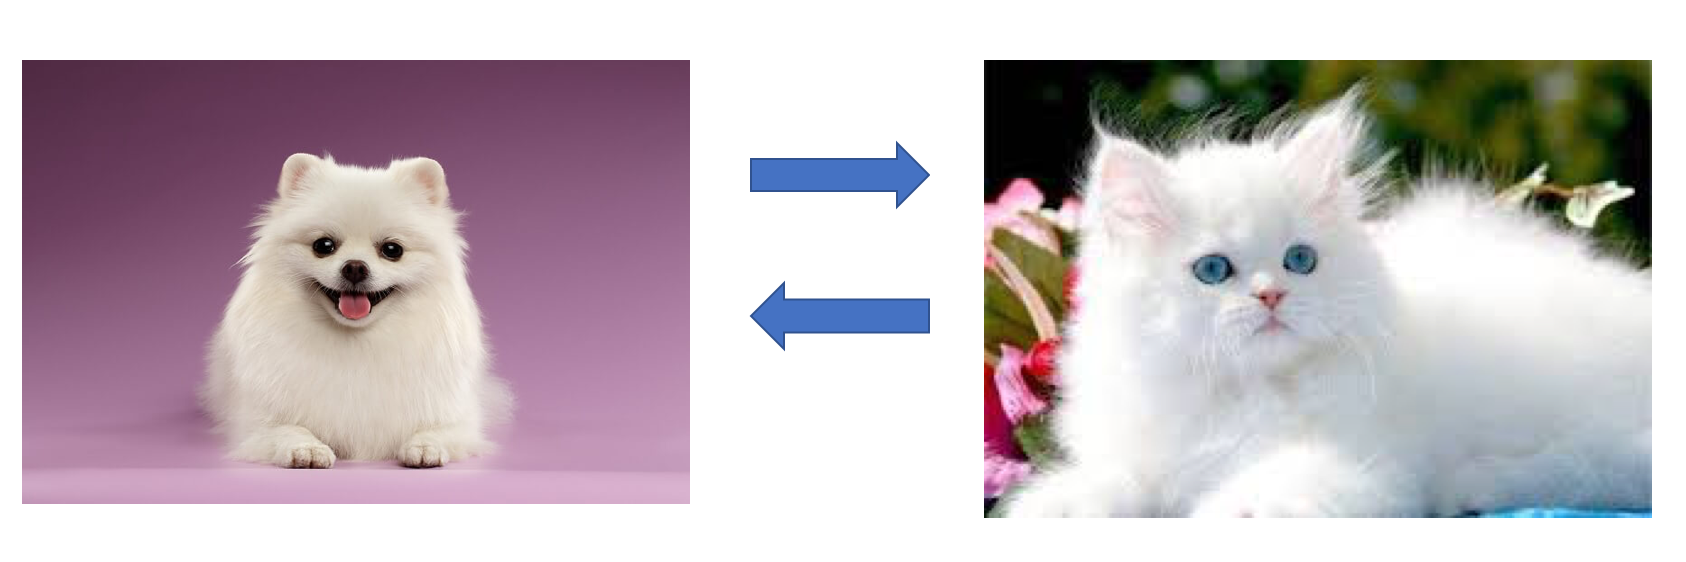
The purpose of this project is to match images of dogs with images of cats (and vice versa) based on color and texture. For example, given an input image of a cat, we wish to find an image of a dog from our dataset that it most similar in terms of fur/skin color and pattern. Our architecture consists of using Mask R-CNN to segment the animal from the image, obtaining a fused feature representation of color and texture features and cluster the images based on similarity. The expected input is a real color image of a dog or a cat. The desired output is an image of the opposite animal type with the most similar fur/skin color and pattern. Currently, we are able to segment images, remove the dog/cat masks, and then extract some form of feature representation from it.
Sample input-output pair
Introduction
We were inspired to do this project from this article. This is an application of content-based image retrieval. There has been a lot of research on CBIR, and we are performing this retrieval based on color and texture, which is also common practice. One thing that we have seen less of is the juxtaposition of image segmentation and CBIR. There are studies that address this, but we aim to see how well this combined approach performs. At the end of the day, we believe that this is just an interesting and fun application of various computer vision techniques.
Planned pipeline of PetSwap
Approach
Summary
Our system contains three distinct components: animal image segmentation, color/texture representation, and clustering. With these three steps we will be able to take any input image of a dog or a cat and output an image with the most similar color and texture. We can simply query our pre-trained clusters with the color/texture representation of the image and return the closest image.Animal Image Segmentation
We use Mask R-CNN to segment the animal out of the image. This model has already been pre-trained on the COCO dataset, which contains color images and segmentation masks of dogs and cats (among many other objects). We used this Mask R-CNN model to segment the animals out of our two datasets (see Datasets subsection under Experiments and Results). The next step is to feed the segmented animals into our texture/color histogram generator and map each feature representation to the image using a dictionary.Color/Texture Representation
Once we produced the segmented animal image, we extracted color and texture features. We are using a combination of various color features at the moment. Firstly, we are using the mean and standard deviation of the red, green and blue channels of the image. Secondly, we are also converting the image's color space to YCbCr and computing the mean and standard deviation across the channels to obtain another feature. Lastly, we are calculating a histogram of the HSV color space. For the texture features, we are using a Gray Level co-occurence matrix, which is characterization of the texture of the image. Using this matrix, we extract statistical measures to use as features. We also plan on experimenting with Gabor filter to extract texture features as well.Clustering
We cluster images of dogs and cats separately by histogram similarity. We will start by running clustering to find similarities between histograms. Once we have clustered our training data from the dog and cat datasets, we will evaluate the performance by testing it with our test sets (see Datasets subsection). When there is a query to our system, we first find the closest cluster center. Once we are within the cluster, we select the closest histogram. Doing so will reduce the time complexity of the algorithm, as it removes the need to compare the new histogram with that of every image in the dataset to find the closest match. For dog input images, we query the cat cluster model and for cat input images, we query the dog cluster model. The chosen image is then returned to the user.Experiments and Results
Experimental Setup
We will divide the dataset into a 80% "training" and 20% testing split. In this case, the training data is the pre-clustered images. In order to test the functionality of our application, we will take the testing data and measure the sum of squared errors (SSE) of the clusters as well as the similarity between the input image and the returned output image.Datasets
We use two main datasets--one containing images of cats and the other containing images of dogs. The Cat Dataset includes 10,000 cat images and the Stanford Dogs Dataset includes over 20,000 images of dogs, classified by breed. Before we can use these datasets to train our k-means clusters, we must first clean the data. This involves extracting images from the dog and cat datasets while also ignoring other metadata files. The dog dataset must be shuffled so that the images are no longer separated by breed. Once we clean the two datasets, we split each dataset into a training and testing set. The data is now prepared for the Experimental Setup.As a side note, we are using a pre-trained Mask R-CNN for image segmentation as mentioned above. This is trained on the COCO dataset.
Existing Code
The main libraries that we plan on using are scikit-image and OpenCV. We plan to use code from several GitHub repositories: Also, we plan to use one of the following clustering algorithms:Implementation Details
We are implementing the pipeline to solve the problem end-to-end. Specifically, we need to create a useful image representation that captures the key information about the images. This is be a combination of texture and color to represent the fur of the pet..Defining Success
Mathematically, we define success for the project to be the elbow of the k vs SSE curve and having a distance of 10% (of the mean distance) between input and output images. We would also evaluate how close the dogs and cats look by have multiple people using the service and reviewing it.Experiments
Mask R-CNN
We hypothesized that it will be accurate when segmenting the dog and cat images from the other datasets. If we found that this model wasn't as accurate, we planned to train it on some of the images from other datasets as well to see if accuracy imporroved. However, the Mask R-CNN model pre-trained on COCO was effective in segmenting out cat and dog images pretty accurately. Using the demo code from the original author of the Mask R-CNNs, we were able to successfully segment out objects in custom images. We processed the output futher to remove bounding boxes and segmentation masks that did not correspond to the dog and cat classes. We then extract pixels corresponing to the remaining masks, and use these pixel values to compute a feature representation of the object.Foreground Feature Representation
We have implemented various feature extractors based on color and texture, and we will experiment with which combination of those feature extractors provide the best clustering result.Distance Function
We can experiment with using different distance functions. However, with our feature representation, we believe that Euclidean distance will be the best option. We expect the final clusters that result from using these two distance functions to be quite different.Clustering Algorithm
There are details of our clustering process that we need to determine through experiments. First, we need to decide whether we would cluster the dogs and cats separately or all together.Next, we would experiment with the clustering methods. We can try both hard and soft clustering. Hard clustering assigns each point to a cluster definitively, soft clustering uses a probabilistic approach to assign probabilities of belonging to each cluster for each point. Both could provide interesting results in this project since we expect hard clustering to give cleaner results faster but soft clustering to perhaps find some insights missing from hard clustering.
Another detail would be what hard clustering algorithm we would utilize. We would decide between centroid-based and density-based, i.e. mean clustering vs. mode clustering. We would figure out these two details by comparing the accuracy of each implementation.
Additionally, we can try varying the value of k in hard clustering. This is key to finding meaningful groups in the dataset. If the clusters are too small, similar images may not be grouped together. On the other, clusters that are too large will group dissimilar images together. We would decide this using the elbow method, trying to find the optimal value of k.
Qualitative Results
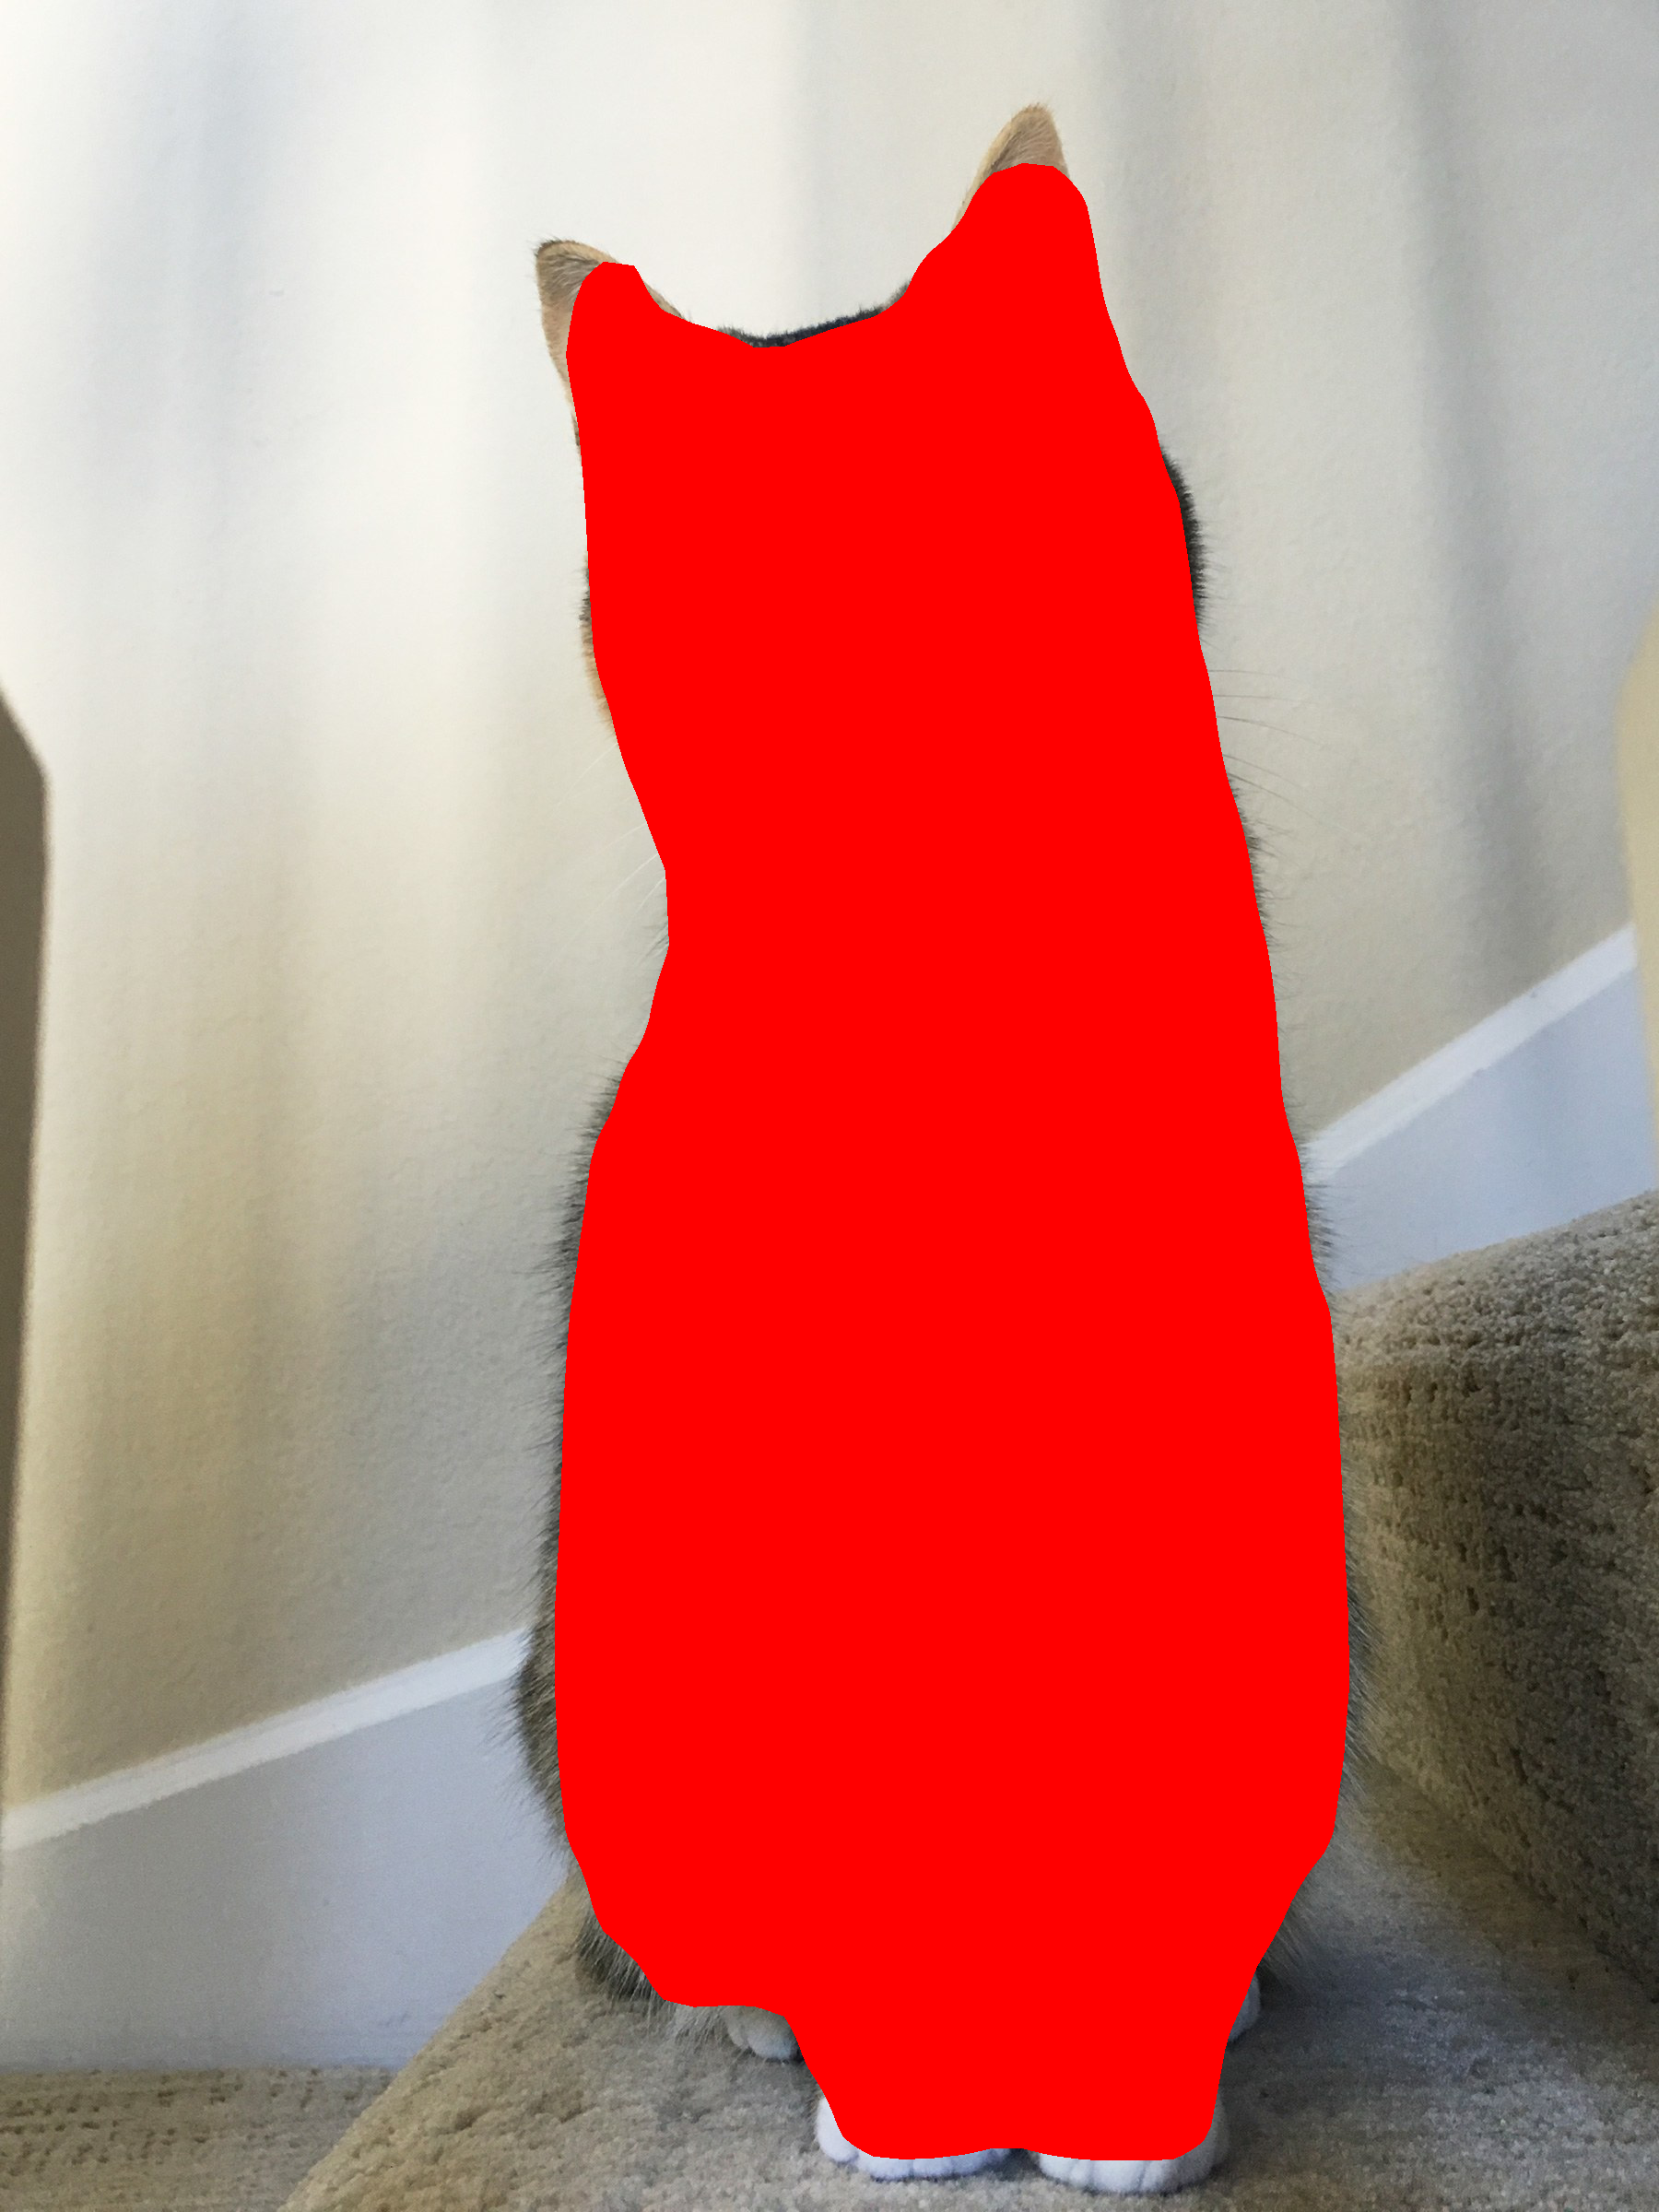
Using the Mask R-CNN implementation, and updating it to detect cats and dogs only, we can produce the following succesful segmentation.
Output of Mask R-CNN
We also created a demo application using Flask and HTML, since these tools integrate with our Python code seamlessly. The user can input an image and press a button to send a POST request to the method that calls our pipeline to retrieve the matching image. The application provides a manual method to conduct end-to-end testing of the pipeline using new input images.

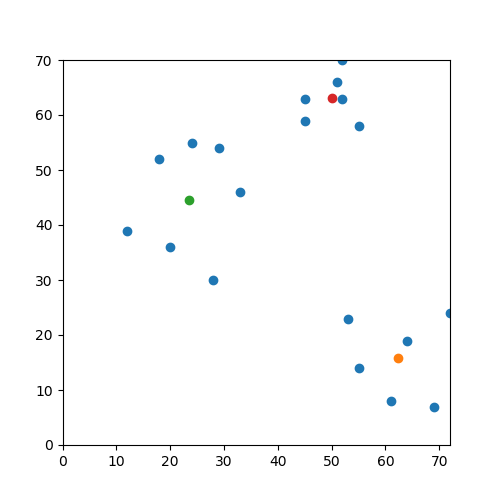
We added initial clustering code for k-means, which runs on dummy data. The next step is to replace the input with the real data consisting of image feature representations. One challenge with the real input is in visualizing the clusters, since the feature representation contains more than two dimensions.

Clustering on dummy data